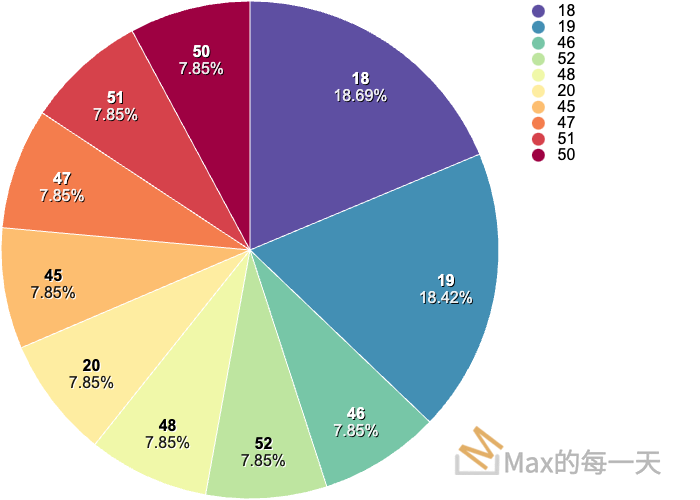
在使用 plot 畫圖的時候,預設 text-anchor 會被設成 medd, 造成 plot 畫出來的圖會長的怪怪的:

plot 官方說明:https://observablehq.com/plot/marks/text#text-options
The following text-specific constant options are also supported:
- textAnchor – the text anchor for horizontal position; start, end, or middle
text-anchor 說明文件:https://developer.mozilla.org/en-US/docs/Web/SVG/Attribute/text-anchor
plot source code:
https://github.com/observablehq/plot/blob/4bbad40906e851fe5ece146f34ecc854342b08da/src/plot.js#L251
  select(svg)
    .attr("class", className)
    .attr("fill", "currentColor")
    .attr("font-family", "system-ui, sans-serif")
    .attr("font-size", 10)
    .attr("text-anchor", "middle")
    .attr("width", width)
    .attr("height", height)
    .attr("viewBox", `0 0 ${width} ${height}`)
    .attr("aria-label", ariaLabel)
    .attr("aria-description", ariaDescription)
    .call((svg) =>
      // Warning: if you edit this, change defaultClassName.
      svg.append("style").text(
        `:where(.${className}) {
  --plot-background: white;
  display: block;
  height: auto;
  height: intrinsic;
  max-width: 100%;
}
:where(.${className} text),
:where(.${className} tspan) {
  white-space: pre;
}`
      )
    )
    .call(applyInlineStyles, style);
從 plot source code 來看,是hard code, 沒有辦法從外部傳入的參數做設定。
寫死(hard-coding)是指在軟體實作上,將輸出或輸入的相關參數(例如:路徑、輸出的形式或格式)
- 解法1,針對新加的圖層,指定 .attr(“text-anchor”, “start”) 就可以不被 middle 影響。
- 解法2,透過 javascript selector 移除 plot source code 裡的 .attr(“text-anchor”, “middle”)。
