原來增加邊框只要設屬性就可以了,而且效果是可以套到 svg 格式裡,不是只有網頁 css 上的效果。
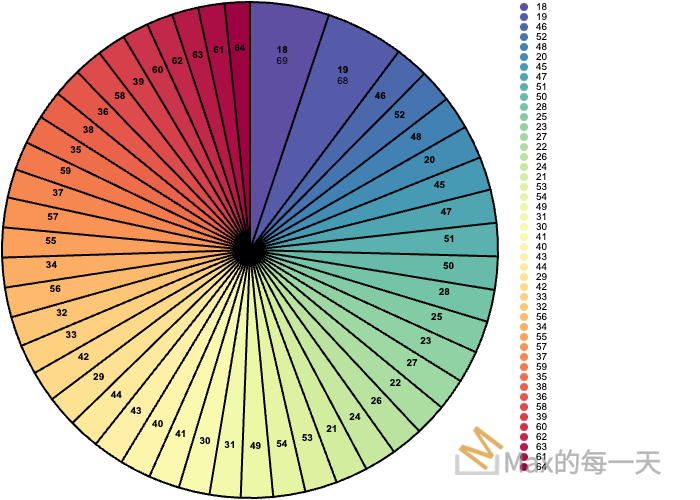
效果圖:

上面程式碼:
.attr("stroke", "black")
.style("stroke-width", "2px")- border color 使用 stroke attribute, 可以使用 #開頭的色碼。
- border size 使用 stroke-width attribute.
資料來源:https://d3-graph-gallery.com/graph/pie_basic.html
完整程式碼:
svg
.selectAll('whatever')
.data(data_ready)
.enter()
.append('path')
.attr('d', d3.arc()
.innerRadius(0)
.outerRadius(radius)
)
.attr('fill', function(d){ return(color(d.data.key)) })
.attr("stroke", "black")
.style("stroke-width", "2px")
.style("opacity", 0.7)
