原來要看到browser post 的資料,還滿簡單的耶!好方便哦。
Firefox截圖:
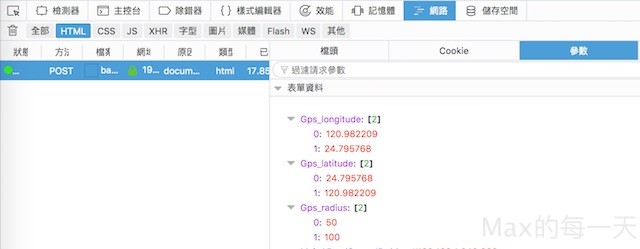
Go to Chrome Developer Tools (Chrome Menu -> More Tools -> Developer Tools). Choose “Network” tab. Refresh the page you’re on. You’ll get list of http queries that happened, while the network console was on. Select one of them in the left. Choose “Headers” tab. Voila!