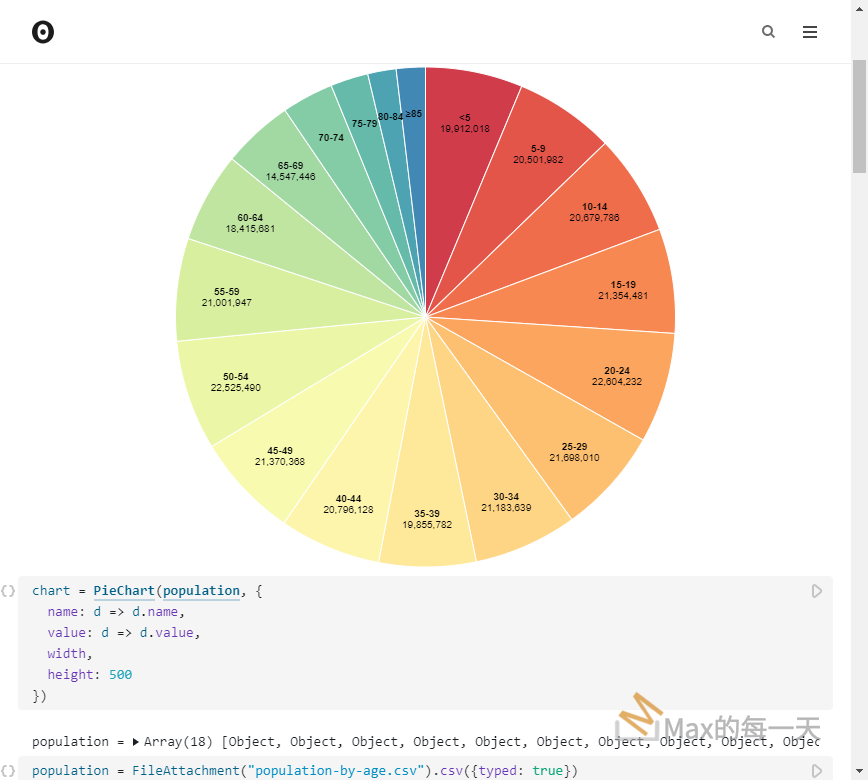
在使用 d3js 畫圓餅圖, 範例雖然看起來有點難, 實際上還滿簡單的, 而且javascript 的元件寫的很物件化, 所以操作起來, 很快就可以理解與上手。
d3js官方範例
- Pie chart component
https://observablehq.com/@d3/pie-chart-component - Donut chart
https://observablehq.com/@d3/donut-chart

相關教學
Most basic pie chart in d3.js
https://d3-graph-gallery.com/graph/pie_basic.html
Create Pie Chart using D3
https://www.tutorialsteacher.com/d3js/create-pie-chart-using-d3js
使用心得
如果你的伺服器程式語言是JSP, 直接使用 d3js 的範例程式:
svg.append("g")
.attr("font-family", "sans-serif")
.attr("font-size", 10)
.attr("text-anchor", "middle")
.selectAll("text")
.data(arcs)
.join("text")
.attr("transform", d => `translate(${arcLabel.centroid(d)})`)
.selectAll("tspan")
.data(d => {
const lines = `${title(d.data)}`.split(/\n/);
return (d.endAngle - d.startAngle) > 0.25 ? lines : lines.slice(0, 1);
})
.join("tspan")
.attr("x", 0)
.attr("y", (_, i) => `${i * 1.1}em`)
.attr("font-weight", (_, i) => i ? null : "bold")
.text(d => d);
會造成 JSP EL( Expression Language, 表達式語言) 的錯誤. 解法, 是避免使用 ${…} 即可, 修改後的範例:
const width = 928;
const height = Math.min(width, 500);

// Create the color scale.
const color = d3.scaleOrdinal()
.domain(data.map(d => d.name))
.range(d3.quantize(t => d3.interpolateSpectral(t * 0.8 + 0.1), data.length).reverse())

// Create the pie layout and arc generator.
const pie = d3.pie()
.sort(null)
.value(d => d.value);

const arc = d3.arc()
.innerRadius(0)
.outerRadius(Math.min(width, height) / 2 - 1);

const labelRadius = arc.outerRadius()() * 0.8;

// A separate arc generator for labels.
const arcLabel = d3.arc()
.innerRadius(labelRadius)
.outerRadius(labelRadius);

const arcs = pie(data);

// Create the SVG container.
const svg = d3.select("#ifilter_data_visualization_chart").append("svg")
.attr("width", width)
.attr("height", height)
.attr("viewBox", [-width / 2, -height / 2, width, height])
.attr("style", "max-width: 100%; height: auto; font: 10px sans-serif;");

svg.append("g")
.attr("stroke", "white")
.selectAll("path")
.data(arcs)
.join("path")
.attr("fill", d => color(d.data.name))
.attr("d", arc)
.append("title")
.text(function(d) { return d.data.name; });

svg.append("g")
.attr("font-family", "sans-serif")
.attr("font-size", 12)
.attr("text-anchor", "middle")
.selectAll("text")
.data(arcs)
.join("text")
.attr("transform", function(d) { return "translate(" + arcLabel.centroid(d) + ")"; })
.call(text => text.append("tspan")
    .attr("y", "-0.4em")
    .attr("font-weight", "bold")
    .text(d => d.data.name))
.call(text => text.filter(d => (d.endAngle - d.startAngle) > 0.25).append("tspan")
    .attr("x", 0)
    .attr("y", "0.7em")
    .attr("fill-opacity", 0.7)
    .text(d => d.data.value));
pie 與 donut 的差異在 innerRadius
pie:
innerRadius = 0, // inner radius of pie, in pixels (non-zero for donut)
outerRadius = Math.min(width, height) / 2, // outer radius of pie, in pixels
labelRadius = (innerRadius * 0.2 + outerRadius * 0.8), // center radius of labels
format = ",", // a format specifier for values (in the label)
names, // array of names (the domain of the color scale)
colors, // array of colors for names
stroke = innerRadius > 0 ? "none" : "white", // stroke separating widths
strokeWidth = 1, // width of stroke separating wedges
strokeLinejoin = "round", // line join of stroke separating wedges
padAngle = stroke === "none" ? 1 / outerRadius : 0, // angular separation between wedges, in radians
donut:
innerRadius = Math.min(width, height) / 3, // inner radius of pie, in pixels (non-zero for donut)
outerRadius = Math.min(width, height) / 2, // outer radius of pie, in pixels
labelRadius = (innerRadius + outerRadius) / 2, // center radius of labels
format = ",", // a format specifier for values (in the label)
names, // array of names (the domain of the color scale)
colors, // array of colors for names
stroke = innerRadius > 0 ? "none" : "white", // stroke separating widths
strokeWidth = 1, // width of stroke separating wedges
strokeLinejoin = "round", // line join of stroke separating wedges
padAngle = stroke === "none" ? 1 / outerRadius : 0, // angular separation between wedges
差異的程式碼:
innerRadius=0, 就會變成 pie
//let innerRadius=0;
let innerRadius = Math.min(width, height) / 3;

const arc = d3.arc()
.innerRadius(innerRadius)
.outerRadius(Math.min(width, height) / 2 - 1);
控制顏色,參考:
https://stackoverflow.max-everyday.com/2024/04/how-to-generate-1000-unique-color-in-d3-js/
