要將 Google AI Studio 下載的 .tsx 檔案在 localhost 預覽,最快的方式是使用 Vite 這個開發工具。因為 .tsx 是 React 搭配 TypeScript 的格式,瀏覽器無法直接讀取,必須透過工具編譯。
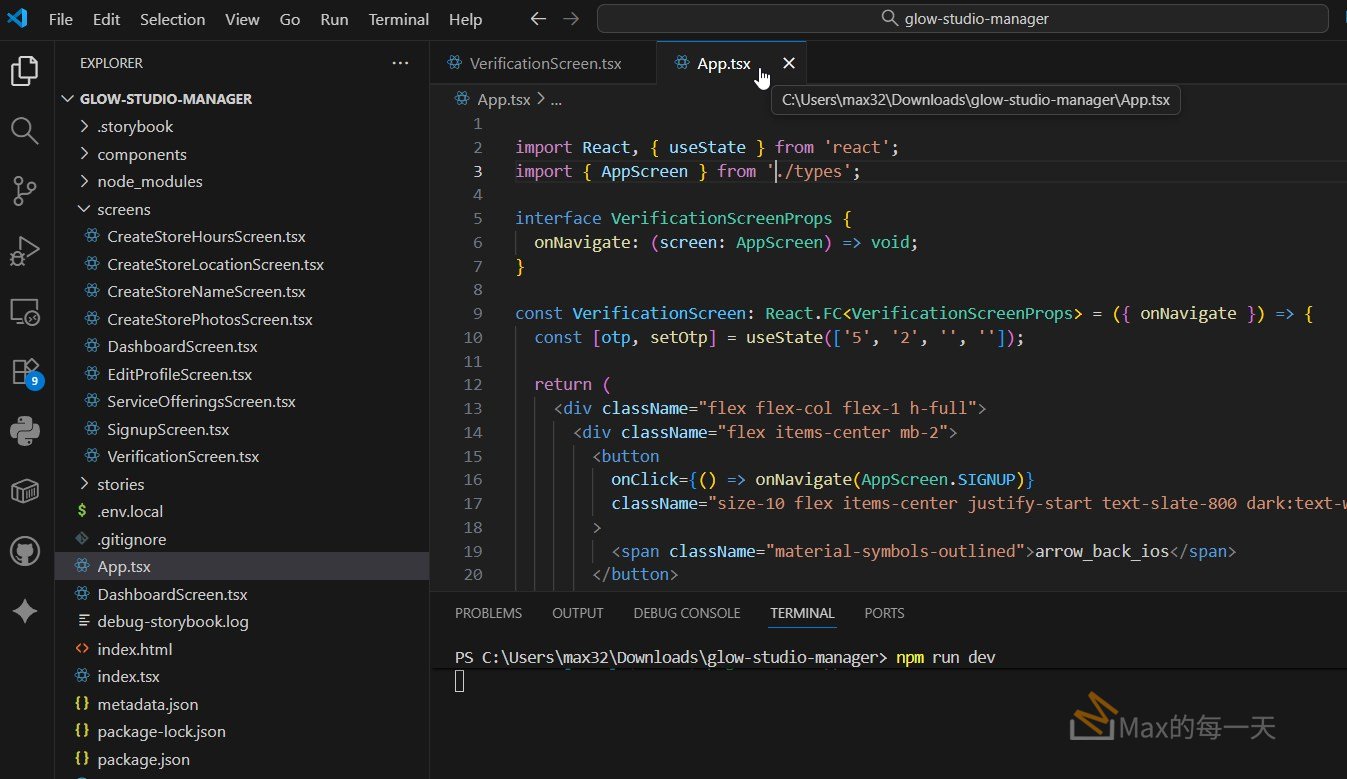
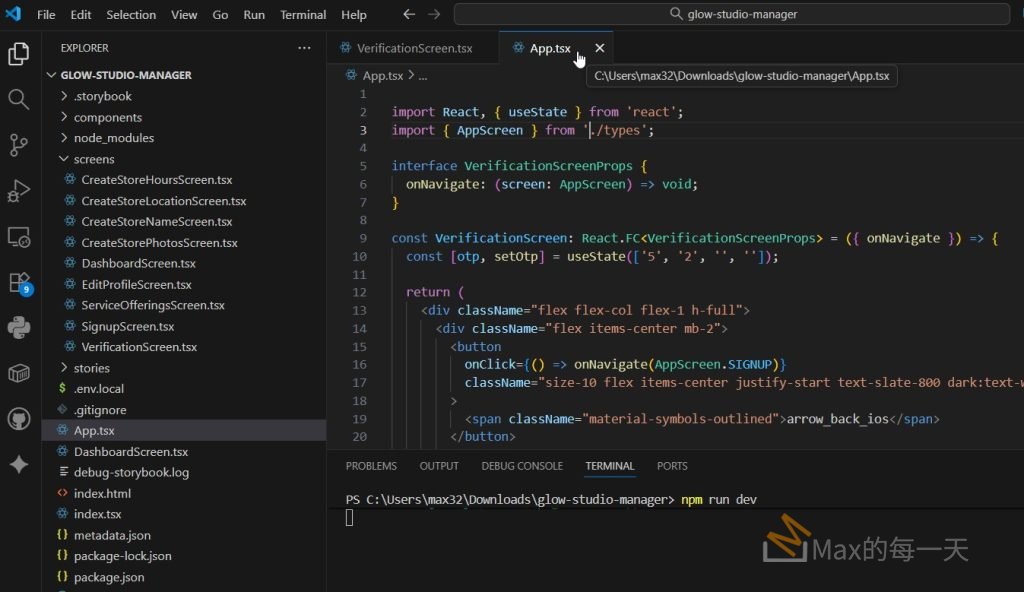
最簡單的解法是在 VS code 中, 把2個 .tsx 都開啟, 複製內容到 app.tsx 再存檔, 就可以立刻在瀏覽器上看到執行結果, vs code 的執行畫面如下:
建立預覽環境
如果你手邊只有單一個 .tsx 檔案,而不是完整的專案資料夾,請按照以下步驟建立環境:
- 建立 React 專案:在終端機輸入指令並選擇 React 與 TypeScript:
npm create vite@latest my-preview-app - 進入資料夾:
cd my-preview-app - 安裝必要工具:
npm install - 替換檔案:將你從 AI Studio 得到的 .tsx 檔案內容,覆蓋掉專案中
src/App.tsx的內容。
處理相依元件
AI Studio 生成的程式碼通常會用到 Tailwind CSS 或 Lucide React 圖示庫。如果畫面看起來排版混亂,你需要安裝這些套件:
- 安裝圖示庫:
npm install lucide-react - 安裝 UI 組件庫:如果程式碼中出現
import { Button } from "@/components/ui/button",這代表它使用了 shadcn/ui。你需要參考 shadcn 官網的指令來初始化環境。
啟動預覽
完成上述準備後,在終端機輸入:
npm run dev
接著打開瀏覽器輸入 http://localhost:5173 就能看到畫面。如果你的程式碼中包含 API 調用,記得確認專案根目錄是否有 .env.local 檔案並填入你的 VITE_GEMINI_API_KEY。
除了在本地端手動架設專案,你也可以考慮以下幾種更快速的替代方案:
線上沙盒平台(免安裝)
如果你不想在電腦上安裝 Node.js,這兩個平台可以讓你直接把程式碼貼上去預覽:
- StackBlitz (推薦):這是目前最接近本地開發環境的線上工具。
- 開啟 vite.new/react-ts。
- 直接把 AI Studio 下載的內容貼到
App.tsx。 - 右側視窗會即時顯示畫面,也能讓你直接在線上編輯。
- CodeSandbox:適合快速測試單一組件。
- 開啟 CodeSandbox 並選擇 React TypeScript 範本。
- 這類平台的好處是,它們會幫你處理好所有的背後編譯邏輯。
VS Code 擴充功能
如果你已經在使用 VS Code,可以利用一些外掛來簡化流程:
- Live Preview:由 Microsoft 官方開發。
- 雖然它主要是預覽 HTML,但如果你配合本地的 Vite 或簡單的編譯器,它可以在編輯器右側直接開一個網頁視窗,不用一直切換瀏覽器。
- ES7+ React/Redux/React-Native snippets:雖然它不能直接執行程式碼,但能幫你快速補齊環境所需的設定,適合想在本地快速跑起來的使用者。
單檔執行工具 (tsx)
如果你只是想測試一段不含 UI 的 TypeScript 邏輯,可以使用 tsx 這個 CLI 工具:
- 在終端機輸入:
npx tsx 你的檔案名稱.tsx - 這不需要建立整個 Vite 專案,適合快速驗證邏輯。但要注意,如果檔案裡包含 JSX 網頁標籤,這個方式通常無法直接渲染出畫面。
AI Studio 直接預覽
其實在 Google AI Studio 介面中,右側通常會有個 Preview 按鈕。如果你只是想看結果而不需要下載後續修改,直接在網頁上點擊預覽是最省事的方法。
如何使用 vs code 的 live preview?
在 VS Code 中執行 Live Preview(即時預覽)主要有兩種方式,取決於你的檔案是純 HTML 還是像 AI Studio 生成的 React 專案。
使用 Live Preview 官方擴充功能
這是微軟官方開發的外掛,適合預覽簡單的網頁檔案。
- 安裝外掛:在 VS Code 左側活動列點擊擴充功能圖示(四個方塊),搜尋 Live Preview 並點擊安裝。
- 開啟預覽:
- 如果是 HTML 檔案:在編輯器右上角會出現一個「放大鏡與視窗組合」的圖示,點擊即可在 VS Code 內部開啟預覽視窗。
- 或是對著檔案按右鍵,選擇 Show Preview。
- 即時同步:當你修改存檔時,右側的視窗會自動更新內容。
針對 AI Studio 的 React 專案 (NPM 方式)
因為 AI Studio 給的是 .tsx 檔案,單純用上面的外掛無法跑起來,必須透過開發伺服器。
- 開啟整合終端機:在 VS Code 頂部選單選擇「終端機」>「新終端機」。
- 啟動 Vite 伺服器:在終端機輸入
npm run dev。 - 連結預覽:
- 按住 Ctrl (或 Cmd) 並點擊終端機顯示的網址(如 http://localhost:5173)。
- 瀏覽器會自動開啟。
- 分割視窗預覽:
- 如果你想在 VS Code 裡面看,安裝上述的 Live Preview 外掛後,在終端機網址點右鍵選擇「Open in Live Preview」,它就會在 VS Code 內部開啟一個瀏覽器分頁。
使用簡易伺服器外掛 (Live Server)
如果你以前習慣使用 Live Server(由 Ritwick Dey 開發),它的操作方式如下:
- 開啟資料夾:必須先用 VS Code 開啟整個專案資料夾。
- 點擊 Go Live:在 VS Code 右下角狀態列點擊 Go Live 按鈕。
- 注意限制:這通常只支援
.html檔案。如果是 AI Studio 的.tsx,建議還是回歸到npm run dev的方式最保險,因為它需要經過編譯過程。
在一個 React 專案中,通常只有一個入口點(Entry Point),預設會渲染 App.tsx。如果你從 AI Studio 下載了多個 .tsx 檔案(例如不同的頁面或組件),想在 localhost 一一預覽,可以採用以下幾種做法:
修改入口點 App.tsx
這是最直覺的方法。你可以把 App.tsx 當成一個「展示架」,透過修改 import 路徑來切換想要預覽的檔案。
- 開啟 App.tsx:找到專案 src 資料夾下的 App.tsx。
- 修改匯入語句:假設你想看
MyNewComponent.tsx,就把原本的 import 換掉。import MyPreview from './MyNewComponent'; - 更換組件內容:在
return的地方直接使用該組件。TypeScriptfunction App() { return ( <div> <MyPreview /> </div> ) } - 存檔查看:只要執行著
npm run dev,瀏覽器就會立刻更新成該組件的畫面。
使用 React Router 建立選單
如果你有很多檔案想快速切換,不想一直改程式碼,可以安裝路由工具來建立一個簡單的選單頁面。
- 安裝工具:
npm install react-router-dom - 設定路由:在 App.tsx 中設定不同的路徑對應不同的 .tsx 檔案。TypeScript
<Routes><Route path="/page1" element={<PageOne />} /><Route path="/page2" element={<PageTwo />} /></Routes> - 預覽:你在網址列輸入
localhost:5173/page1就能看到第一個檔案,輸入/page2就能切換到下一個。
使用 Storybook (進階方案)
如果你下載的是大量的獨立 UI 組件,Storybook 是最專業的預覽工具。
- 初始化:在專案資料夾輸入
npx storybook@latest init - 功能:它會幫你開一個獨立的 localhost 埠號(通常是 6006),左側會列出所有組件清單,點擊就能直接預覽,不需要去動到 App.tsx。
臨時測試的小技巧
如果你只是想快速掃視,不打算長期開發,可以善用 VS Code 的分頁與 Vite 的熱更新:
- 將
App.tsx與你的目標檔案(如ComponentA.tsx)並排顯示。 - 將
App.tsx內容清空,直接把ComponentA.tsx的程式碼全選貼上到App.tsx覆蓋。 - 預覽完後按
Ctrl+Z復原,再貼上檔案 B。這雖然暴力,但在處理 AI 生成的零散檔案時速度最快。
你想嘗試用 React Router 做一個選單介面,還是需要我提供一段 App.tsx 的修改範本供你參考?
Live Preview – VS Code Extension 📡
⚠️ WARNING: This extension is still under development! ⚠️
An extension that hosts a local server for you to preview your web projects on!
This extension is most useful for projects where a server is not already created (e.g. not for apps using React, Angular, etc.). To work with these, feel free to run the Simple Browser: Show command that is already built-in with VS Code.
Table of Contents
Features
HTML File Previewing
Preview your HTML files quickly by clicking the preview button in the top right corner of your editor or using the context menu.
Embedded Preview
A preview is available in-editor for the files hosted by the server.
The simple embedded browser features the following:
- Page history tracking
- URL bar for address-based navigation
- Expandable menu, allowing users to:
- Preview the current page in browser
- Perform a page search
- Tip: You can also use CTRL+F to open the find box and Enter to go to the next result
- Open the editor’s webview DevTools
Live Refreshing
See the changes as you make them. By default, changes appear as you make them in the editor. You can also change this in the extension settings (via livePreview.autoRefreshPreview) to refresh the preview on save or not at all.
Individual pages can opt out of live refreshing by adding the <body> attribute data-server-no-reload.
Persistent Server Task with Server Logging
If you’re looking for a persistent server to run, you can run a Live Preview task, which also logs the server traffic. This can also be launched using the Live Preview: Start Server Logging command. You can click on the traffic to open the file location of the file returned by the server.
External Browser Previewing
Although all of the images above use the embedded browser, you can also experience the same features in an external browser.
You can edit the preview target in the extension settings.
External Browser Debugging
The external browser preview also supports debugging via the built-in js-debug extension and attaching to the Edge Devtools Extension. This allows support for features such as setting breakpoints and inspecting elements.
Run Live Preview: Show Debug Preview in the command palette to get these debugging features.
Console Output Channel (For Embedded Preview)
For a simple view of the embedded preview’s console messages, go to the Output tab and select Embedded Live Preview Console in the dropdown.
Workspace-less Previewing
No workspace? No problem! For a quick preview of your file, the server can also access files outside of your workspace to preview.
Notes about workspace-less extension use:
- Files without a workspace will be served on its own server instance and will use its absolute path as the file path.
- Linked files for these pages may not be correct if they are relative to a specific root (e.g. a project root).
- Tasks do not work outside of a workspace, so a server will just launch in the background upon external preview when outside of a workspace. You can use the
Live Preview: Stop Servercommand to kill the server in this case.
Multi-root Support
Live Preview works cleanly with your multi-root workspaces! It will simply open an additional server for each root that you open a preview on.

You can view the ports that are open for Live Preview by hovering the status bar indicator (usually located in the bottom-right corner of the window).

Running the extension
You can install the extension in the marketplace here. To contribute, see the contributing page.
FAQ
Q. What does the "Previewing a file that is not a child of the server root. To see fully correct relative file links, please open a workspace at the project root or consider changing your server root settings for Live Preview." message mean?
A. Either:
- You have no workspace open and opened a preview.
- You opened a preview for a file that is not a part of your workspace(s).
- You have the
livePreview.serverRootsetting set to a sub-folder in your workspace and your file is not a child of that subfolder.
Why does this happen?
The server is hosted from the root of the workspace that the user opens (or a subfolder of the workspace based on livePreview.serverRoot). Files outside of this can be previewed, but some file paths (such as a link to the root) may not go to the right place. If you are working on a web project, it is advised that you open a workspace at the root of the project.
Q. I’m trying to use Live Preview in Codespaces and the embedded preview isn’t working.
A. Currently, you will need to manually navigate to the links host the forwarded port content before it works
In the area of the editor where the integrated terminal usually is, navigate to Ports and open the local addresses (usually at ports 3000 and 3001) in the browser. You can do this by using CTRL+Click on the URLs in the Ports menu.
Allow the browser to perform the necessary redirects, then close the windows. Re-open the preview window and it should work now.
Q. Why does my external browser preview look different than the preview in the embedded browser preview?
A. Aspects such as styling might look different based on the browser cache of your external browser or any other client-side state. Try clearing your cache and restarting your browser.
Inspirations
Special thanks to the following extensions for inspiring Live Preview! 💡
Issue Tracking
Please file issues against the VS Code Live Preview repository.
Changelog
See the project’s changelog here.
